


This code showcases the creation of wind rose plots for different time periods, using worldmet and openair packages, including wind rose plots for the entire period, specific months, and seasonal wind rose plots. Each section demonstrates a different approach to generating wind rose plots based on the specified time frame.
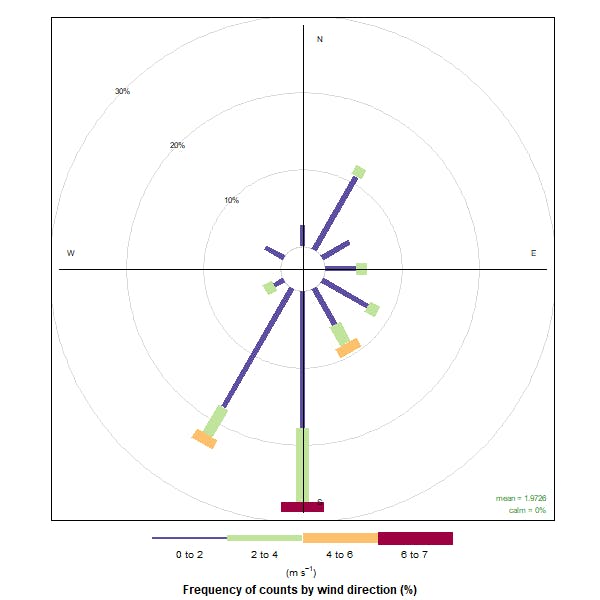
1. Wind Rose Plot for the Period 2014 to 2023
library(openair)
library(worldmet)
# Define the start and end years for the period
start_year <- 2014
end_year <- 2023

# Initialize an empty list to store data for all years
all_years_data <- data.frame()

# Loop through the years 2014 to 2023
for (year in start_year:end_year) {
  # Import NOAA data for the specific station and year
  met_data <- importNOAA(code = "406110-99999", year = year)

  # Append the data for the current year to the list
  all_years_data <- rbind(all_years_data, met_data)
}

# Create a wind rose plot for the aggregated data
windrose <- windRose(all_years_data)

# Print the wind rose plot
print(windrose)

# Save the wind rose plot as a PNG file with specified width and height (600x600 pixels)
png("wind_rose_plot_Pirmam_2014_2023.png", width = 600, height = 600)
print(windrose)
dev.off()

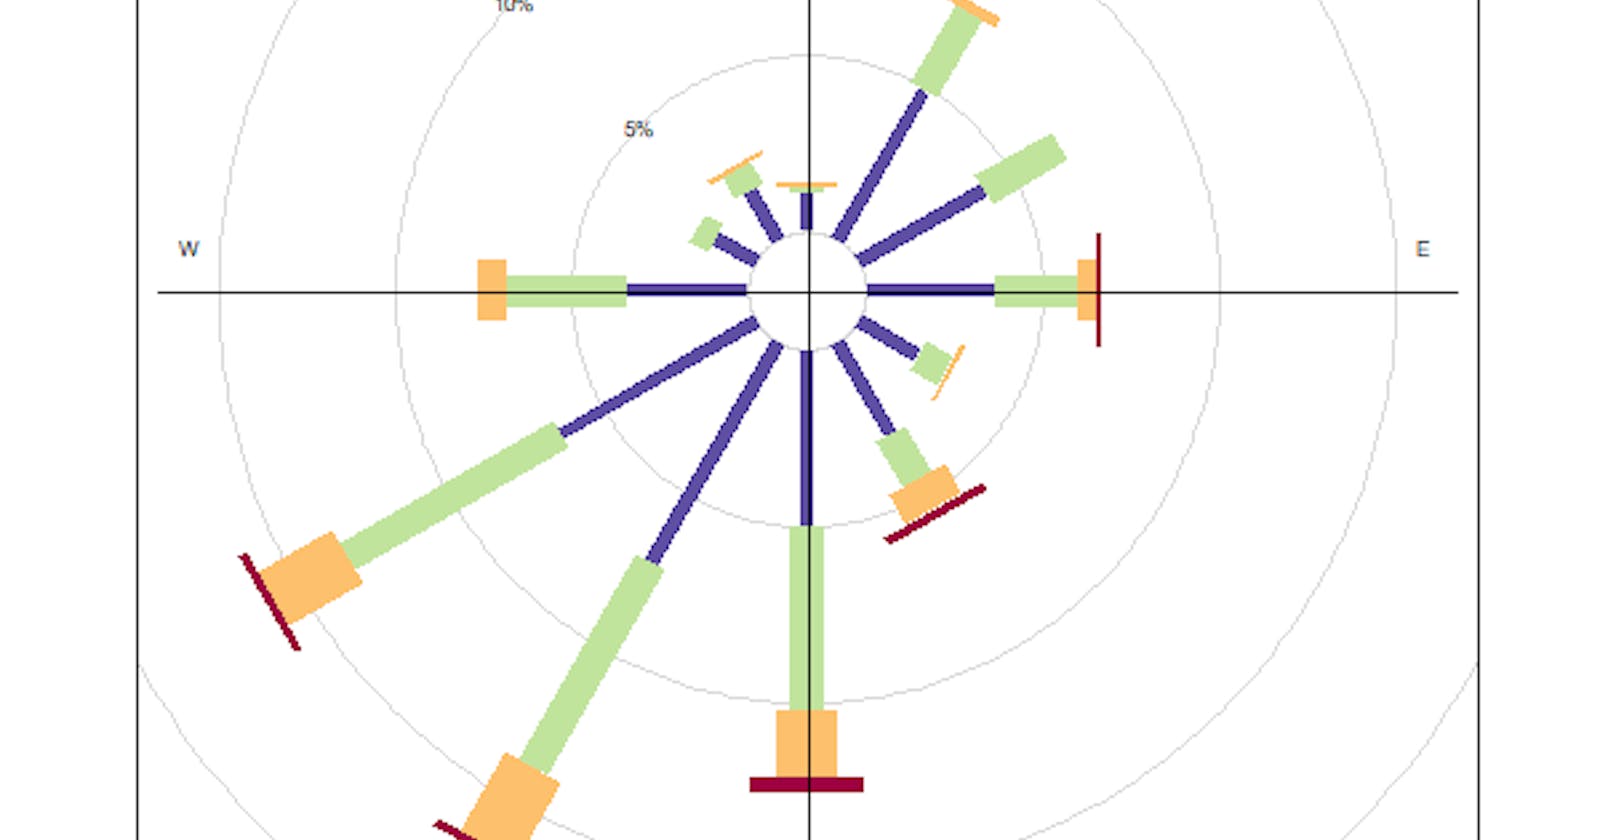
2. Wind Rose Plots for Specific Months from 2014 to 2023
# Define the start and end years for the period
start_year <- 2020
end_year <- 2022

# Initialize an empty list to store wind rose plots for each month
windrose_plots <- list()

# Function to check and add missing columns as NA columns
add_missing_columns <- function(data, ref_cols) {
  missing_cols <- setdiff(ref_cols, colnames(data))
  for (col in missing_cols) {
    data[[col]] <- NA
  }
  return(data)
}

# Loop through the months
for (month in 1:12) {
  # Initialize an empty data frame to store aggregated data for the month
  aggregated_data <- data.frame()

  # Loop through the years in the period
  for (year in start_year:end_year) {
    # Import NOAA data for the specific station and year
    met_data <- importNOAA(code = "406110-99999", year = year)

    # Filter data for the specific month and year
    met_data <- subset(met_data, format(date, "%m") == sprintf("%02d", month))

    # Append the filtered data to the aggregated data frame
    if (nrow(met_data) > 0) {
      if (nrow(aggregated_data) == 0) {
        aggregated_data <- met_data
      } else {
        # Ensure all data frames have the same structure before combining them
        aggregated_data <- rbind(aggregated_data, add_missing_columns(met_data, colnames(aggregated_data)))
      }
    }
  }

  # Create a wind rose plot for the aggregated data
  windrose <- windRose(aggregated_data)

  # Store the wind rose plot in the list
  windrose_plots[[month]] <- windrose
}

# Save the wind rose plots as PNG files
for (month in 1:12) {
  png(paste("Pirmam_for_period_wind_rose_plot_month_", month, ".png", sep = ""), width = 600, height = 600)
  print(windrose_plots[[month]])
  dev.off()
}
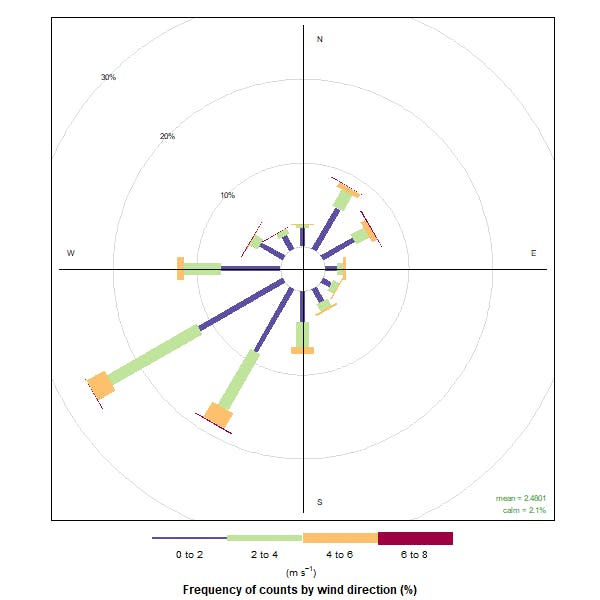
3. Seasonal Wind Rose Plots for the Period 2014 to 2023
# Load necessary packages
library(openair)   # Package for air quality data analysis and visualization
library(worldmet)

# Define the start and end years for the period
start_year <- 2020
end_year <- 2022

# Define the start and end months for each season
seasons <- list(
  Spring = c(3, 4, 5),
  Summer = c(6, 7, 8),
  Autumn = c(9, 10, 11),
  Winter = c(12, 1, 2)  # December of the current year and January and February of the next year
)

# Initialize an empty list to store wind rose plots for each season
windrose_seasonal_plots <- list()

# Loop through the seasons
for (season_name in names(seasons)) {
  # Initialize an empty data frame to store aggregated data for the season
  aggregated_seasonal_data <- NULL

  # Extract start and end months for the current season
  season_months <- seasons[[season_name]]

  # Loop through the years in the period
  for (year in start_year:end_year) {
    # Import NOAA data for the specific station and year
    met_data <- importNOAA(code = "406110-99999", year = year)

    # Filter data for the specific months of the current season
    met_data_season <- subset(met_data, format(date, "%m") %in% sprintf("%02d", season_months))

    # Append the filtered data to the aggregated data frame for the current season
    if (nrow(met_data_season) > 0) {
      if (is.null(aggregated_seasonal_data)) {
        aggregated_seasonal_data <- met_data_season
      } else {
        # Ensure all data frames have the same structure before combining them
        if (identical(names(aggregated_seasonal_data), names(met_data_season))) {
          aggregated_seasonal_data <- rbind(aggregated_seasonal_data, met_data_season)
        } else {
          warning("Data frame structure mismatch. Skipping...")
        }
      }
    }
  }

  # Print the structure of the aggregated data frame
  print(str(aggregated_seasonal_data))

  # Create a wind rose plot for the aggregated seasonal data
  windrose_seasonal <- windRose(aggregated_seasonal_data)

  # Store the wind rose plot in the list
  windrose_seasonal_plots[[season_name]] <- windrose_seasonal
}

# Save the wind rose plots for each season as PNG files
for (season_name in names(seasons)) {
  png(paste("Pirmam_for_period_wind_rose_plot_", season_name, ".png", sep = ""), width = 600, height = 600)
  print(windrose_seasonal_plots[[season_name]])
  dev.off()
}
In this blog post, we explored how to create wind rose plots using the openair and worldmet packages in R. Wind rose plots are valuable tools for visualizing wind patterns over a specified period. We demonstrated how to generate wind rose plots for different time periods, including yearly, monthly, and seasonal aggregations, using historical weather data from NOAA. By following these examples, researchers and weather enthusiasts can gain insights into the prevailing wind directions and speeds, which can be useful for various applications such as climate studies, urban planning, and renewable energy assessments. With the flexibility of R and the comprehensive data provided by NOAA, creating informative wind rose plots has never been easier.